About this website
If you’d like to print the whole FAQ, click on ‘expand all’ and then, you can print with your browser’s printing function.
- very complete for professionals but simple enough for amateurs !
- a procedure that avoids mistakes to obtain valid graphs and easy to compare to others
- MMM measurement is completed with other signals to check amplitude but also phases
- the MMM method gives results nearer to what is really perceived than other methods
- the target correction is automatically processed from your measurement
- target can be finely adjusted
- advanced FIR correction is calculated for the processor or software you are using
- this is the only method that is optimised for separated channels but also for channels driven simultaneously : this is much better in low frequencies
- a full report is available in .png pictures
- with just one sound file, a full set of analysis and graphs is calculated and gives a very complete view to understand the room and loudspeakers and their interaction, and a good base to calculate corrections to better your listening experience
- various people getting exactly same graphs give the possibility to easily compare different setups
- extensions to 7.1, 9.1.4, 22.2, Atmos,… systems will come, including DCP sound files
- you may even use your phone and mic to record
MMM is a measuring method with a microphone moved by hand near the listening place : response obtained with this method gives a reliable representation of audibility.
The most complete infos about MMM method, I published it a long time ago…
http://www.ohl.to/audio/downloads/MMM-moving-mic-measurement.pdf
Other readings :
https://www.aes.org/e-lib/browse.cfm?elib=19477
Who else is using MMM ?
Kali Audio, see MMM in video : https://www.youtube.com/watch?v=6RiuwqzjqlQ
https://www.erinsaudiocorner.com/loudspeakers/ interesting because for loudspeaker tests, MMM (called Moving Mic Average by Erin) is compared to Klippel’s results : it proves that MMM is very comparable to Harman’s In-Room or CEA-2034 prediction based on anechoic measurements.
The test track is a sequence of various signals that are choosen to permit all analysis seen on the graphs :
- start sequence with synchronisation signal and identification frequency
- log sine sweeps (Farina signal) for impulse responses, spectrograms, wavelets, distortion,…
- short bursts for timing analysis
- pink noises for MMM for independant channels and simultaneously. The pink noise is in conformity with SMPTE standard ST-2095-1, see also here : https://www.ohl.to/archives/395
- if you set level so that the starting voice is at at reasonable level (like a person speaking in the room), the level of the sweeps will be near 75dBC, the pink noise per channel will be between 75 and 80dBC and the simultaneous pink noise on both channels between 80 and 85dBC.
- at the end, there is another sync signal used to compensate for any mismatch between player and recorder clocks
- Without registering, you are a visitor and you can see Measurements and read FAQ.
- Registering is completely free and gives you member status and access to pages “Upload recording“, “My measurements” and “My profile“.
- When registering, you will have to fill a field “Company or Title”. This will be the name of the main folder for all your measurements, images and subdirectories. The folder structure will be : \title\studio\date\ with dates automatically added and “Studio or reference” being a field to complete when uploading a recording. Having dates helps you to check evolution of performances in time and see any degradation.
- Please note that the field “Company or title”, can only be related to one user and cannot be used later by another user (unless they are from same company, then please ask us). You cannot use a company name for which you have no rights : your account may be terminated without notice.
- Accepted are alphabets, numbers, underscore “_” and spaces (but no space at beginning or end and no consecutive spaces). Avoid accents or special characters in “Company or Title” and “Studio or reference”.
- Do not forget to finalize registration by clicking on the link in the mail you’ll receive.
- When you are registered, you can use the “Upload recording” form to test if your recording file is accepted and valid.
- If everything is ok, you can buy a plan to get the full results
Better measurements can give better corrections : generally when you EQ based on a measurement that is not conform to what we hear, the correction may worsen the listening experience ! That’s why we think MMM is a safe and reliable way to mesure and base correction.
Indeed, it works for any stereo or 5.1 setup with any loudspeaker brand or model : activ or passiv loudspeakers, closed, vented box or OB, multiway or single driver, compression driver and horns, etc…
In near future, other setups such as 7.1 or Atmos 7.1.4 will also be added.
It is not our job to recommend some brands. But generally the best loudspeakers come from companies that publish complete technical datas. Just check their websites…
REW, ARTA, Rephase,… are very nice measurement or correction softwares. But both need some know-how to get valid results. This takes time. And it is difficult to compare between various audio sytems because so many parameters can be different.
Loudspeakers.audio method is quicker, the process gives results that are valid and comparable to others users measurements. But this website and REW, ARTA,… can be nicely complementary.
Really recommended, complete and easy to understand:
Sound Reproduction: The Acoustics and Psychoacoustics of Loudspeakers and Rooms, by Floyd Toole
The best information comes from Audio Engineering Society, some information is free but you need to register and pay a yearly fee to have access to the whole library.
Very recommended about FIR correction is Denis Sbragion DRC documentation.
To go a bit deeper than Toole’s book, I would highly recommend to read Earl Geddes, David Griesinger and JJ Johnston presentations, books and articles. “creme de la creme” in audio !
You need to have javascript enabled for your browser and also Active-X for Internet Explorer.
Some ideas, but might take some time :
- check and improve performance metrics
- allow more time at start for recorded file
- import other mic calibration files
- export EQ for IIR parametric filters (?)
- multichannel analysis for 7.1, 9.1.4, Dolby Atmos, DTS-X,…
- solve usb problems that we have in some cases
If you have any good idea, just drop me a mail support(at)loudspeakers.audio
My own web site is www.ohl.to and I’m working in audio for many years, especially in pro audio. I have calibrated hundreds of professional studios, stereo to Atmos and DTS-X, for mixing rooms, movie theaters, broadcasters, post-production and mastering studios, but also some hifi systems. I’m a long time member of the AES and participating to the working group SC-04-08 (Working group on Measurement and equalization of sound systems in rooms). I also have been product manager for the launch of compactDisc in 1982 and later, Managing Director of Revox-Studer in France.
Quite a long time ago, I published on my website, the presentation of MMM a measurement technique now used by many and which is the basis fof loudspeakers.audio method.
This web site is only to used for acoustics measurements and audio related topics. Uploading other kind of pictures is forbidden and the user may be banned without notice.
If you have questions or problems, or a just good suggestion, please send a mail to support(at)loudspeakers.audio
1 november 2025 :
- performance calculation changed for low frequencies deviation 30-120Hz : values are slightly modified only when bass level target is near 0dB
2 may 2025 :
- corrected early/late response in graph S16 of page p3
21 april 2025 :
- slight mods on coefficient of target slope in auto-music mode : bright/balanced/warm changed from 14/18/22 to 10/15/20. This may reduce old slopes by about 14%/8.5%/5 %, ie when balanced was about -1.4dB/oct, it will now be about -1.3dB/oct
12 april 2025 :
- in page 3, disabled distortion graph because it was often not valid (measuring mic distortion instead) and added a new early/late response graph. Moved down localisation graph in same page.
3 november 2024 :
- donors are now allowed to delete files and folders
15 september 2024 :
- user is not anymore allowed to delete his own folders or files. Only Donors can add “PRIVATE” or “private” to folder or file name to hide it to other users : this is to give me possibility to analyse all measurements uploaded (ie for some statistics)
24 august 2024 :
- changed some details on graphs in page S1 especially on targets views. The only important thing is that the LF (low freq) target is now for L and R and not for L+R. The L+R target is simply at +6dB above the choosen target value, ie if you choose LFtarget = 300, the L+R taget under 120Hz will be +6dB
21 march 2024 :
- all Google sync should be over now
- modified color of centre channel in graphs
- corrected L+C+R curve in S1 graph
2 march 2024 :
- still some Google sync problems !
18 december 2023 :
- now an automatic link to private folder is set for previous and new users in the Use-your-Drive plugin
17 december 2023 :
- due to some Google sync problems (changed account and API mods), upload folder was sometimes duplicated (ie recreating myfolder(1) when myfolder was already here), and so processing of files was sometimes done in wrong folder ! This has now been solved but it took some time to relink private folders to their owners.
5 november 2023 :
- impulse responses sweepirL1, sweepirR1,… together with targetdrc.txt are exported in the correction48/REW folder. This can help to simulate parametric equalisation in REW.
28 october 2023 :
- solved a bug when audio file was only numbers with operations, ie 30-09-23 (name was calculated to -2 !)
11 september 2023 :
- solved a cache problem when more than one user were uploading at same time, the destination folder could be the wrong one !
- corrected PORC error : correction file was allways 4096 taps at 48kHz (or 8192 taps at 96kHz) instead of correct value for choosen processor
17 august 2023 :
- added MiniDSP Flex in the processor list : the bin correction files can be found into the 96kHz folder with 2042 taps (equivalent length is 1021 taps at 48kHz). Flex total FIR is 4096taps with a minimum of 6 taps per channel so max correction in stereo is 2042 taps per channel.
27 may 2023 :
- added PORC Python Open Room Correction in minimal phase and for stereo systems. For 5.1, it will be added later.
26 avril 2023 :
- preparing for PORC (Python Open Room Correction), a bug was introduced last week with microphone calibration, this has been solved today. Those who uploaded files within last days may reload to get correct results (differences are mainly in high frequencies). PORC should be ready in a few days but I don’t expect very different results from the actual DRC.
- PRIVATE plan has been temporarly stopped due to some regex problems ;)
28 february 2023 :
- corrected a bug that sometimes wrote “Valid Umik found” instead of channels count ! This avoided DRC calculation.
30 january 2023 :
- added a PRIVATE plan
- added Stripe for payment and donation
10 december 2022 :
- correction on the Dolby Atmos Music target
19 november 2022 :
- avoid showing some errors on server that could block process queue
15 november 2022 :
- correction of a bug of calculation for bright and warm targets
05 november 2022 :
- correction of larger time drifts, up to 2000ppm instead of 200ppm (Redbook max is 100ppm)
- improved target calculation in case of non monotonic reverberation time
30 october 2022 :
- adding few samples of silence at start of minphase correction files so that Sox resampling works correctly
24 october 2022 :
- resampling to other frequencies (44.1, 88.2 and 96kHz) are now of higher quality (Sox VHQ instead of HQ)
21 october 2022 :
- new feature when adding SEPARATED, COMMON, IPC in studio/title to force different modes of correction. With no option, the HYBRID mode is used.
18 october 2022 :
- added output of correction files at various frequencies (44.1, 48, 88.2 and 96kHz)
17 october 2022 :
- bug fix : in p1 of graphs, the LR black curve was wrongly displayed on frequency scale. Seems that this bug was introduced on october 14th.
- added a test feature to calculation of differential phase correction : add IPC in the Studio title and the phase correction will be separatly calculated in low frequencies
23 september 2022 :
- modified hybrid correction for a better result with assymetrical setups where L and R have noticeable different responses in low frequencies (mean calculations are now in dB instead of voltages)
12 september 2022 :
- added subfolders wav/bin/json/wav-stereo/REW into correction folder to separate correction formats
- stereo correction wav file was two times right channel : corrected
24 august 2022 :
- fixed : when choosing “none” in processor list, correction was not computed, even if “measure and correct” was choosen
- added some new lftargets : 100,200,300,400,600
- correction files min and lin hybrid are also available in stereo now
07 august 2022 :
- fixed startup of program on server in case of unattended restart of computer
05 august 2022 :
- fixed a recent bug that avoided use of the microphone calibration file
18 june 2022 :
- forced an automatic restart/logon of the computing server in case of mains failure (this happened from time to time in the lasts weeks !)
09 june 2022 :
- in some cases, when new files were uploaded while a file is processed, a “missing file” error could occur because some path was modified and could block the whole files queue ! A correction is done that, hopefully, should avoid this major problem.
06 may 2022 :
- even less phase correction at lower frequencies by reducing window size
29 march 2022 :
- improved linphase correction with less phase correction on bass frequencies (using shorter windows for phase calculation). Amplitude difference between linphase and minphase is also much reduced now in lower frequencies.
19 march 2022 :
- correction of comparative delay which could be wrong when record had to be resampled
07 march 2022 :
- changed table “List by model” : ordering of colums changed and score is now showed
05 march 2022 :
- bug solved when a field contained ‘ or ” (quotation marks)
26 february 2022 :
- solved a bug in NBD Narrow Bandwidth Deviation calculation for multichannel 5.1 : the resulting score was too low
7 february 2022 :
- solved (hope so…) a very problematic bug : when a measurement was uploaded before another one was completed, the second one could be stucked and never completed
29 january 2022 :
- better estimation of channels difference for correction level adjustment : level is now checked only above 200Hz (it was measured with B weighting before)
26 january 2022 :
- a bug on correction level was introduced two days ago : solved
25 january 2022 :
- much improved speed for conversion of IR to .json output files for Xilica and QSys
24 january 2022 :
- a little improvement on correction in the highest frequencies
23 january 2022 :
- added export of correction to .json format directly valid for QSys and Xilica Solaro
- renamed LFtarget choices 0/3/6/9 to 100/103/106/109
21 january 2022 :
- corrected a problem when a folder was deleted by user during the process
- added 0/3/6/9 dB choices on LFtarget to improve low frequency response especially when the FIR filter has less than 3072 taps
13 january 2022 :
- improved calculation of inter-channels level correction
12 january 2022 :
- corrected bug in the “volume” and “distance” display on graph pages p0 and p1
11 january 2022 :
- did a lot of code cleaning and some changes on various graphs
23 december 2021 :
- within last month, there was a bug in the phase measurement where phase graphs scale was wrong and DRC linear phase correction was not optimised for phase (amplitude was fine)
20 december 2021 :
- moved from Gnu Octave v5 to v6, and from Gnuplot graphics toolkit to qt toolkit : had to adapt many graph parameters
- in p7, graph simulated “C6 step response after hybrid linphase correction” is wrong but i’m working on it
07 december 2021 :
- changed range of spectrogram graphs S19 and S20 of p4 from 37dB to 30dB
- modify steps plots in page p7 because of a bug in display
04 december 2021 :
- changes in correction plots : added step responses before/after correction in page p7, corrected graphs in p8 depending on number of taps
05 november 2021 :
- if for some reasons, the graphs are no calculated and shown, I’m working to give the user comprehensive reasons.
03 october 2021 :
- I think that the Google problem and stucked graphs are solved but for now, you can only upload one file in a Studio at a given date.
23 september 2021 :
- a real bug that sometimes avoided calculation of graphs was due to inconsistencies between Google sync and the Windows shell : sometimes the shell did not update changes. A bypass has been found and I hope it completely solves the problem.
17 september 2021 :
- added “Dolby Atmos Music” as a new option for the target
10 september 2021 :
- changed target .txt file to target.drc because the .txt could in certain cases be erroneously used as mic correction file
21 august 2021 :
- improved compensation of player and recorder clocks
- target files are now exported in “My measurements” folder so one can use the target with other softwares
03 june 2021 :
- added mismatch compensation of player and recorder clocks (only use LA2v3 files for now)
20 may 2021 :
- .json correction files are reformatted so to be used directly by QSys and Xilica processors
18 may 2021 :
- Changed centering of response on S1 of page 1 because mic cal is now included. Centering is only calculated under 11.5khz so it should not change a lot but it may slightly change performance values.
17 may 2021 :
- Changed page 6 (p6) validity test to page 0 (p0) with eventually error messages. This p0 is plotted even if record is not valid.
12 may 2021 :
- Changes in crosscorrelation should solve some rare cases when sync signal was missed and analysis was skipped.
09 may 2021 :
- solved :) a vicious bug that appeared only when target at some frequencies had decimals
- solved : in some cases, room volume and distance were not shown on graph p1
08 may 2021 :
- no more crash due to : mic cal files with phase, non monotonic cal files or cal files with blank lines
07 may 2021 :
- solved some login problems due to SSL with not secured content (such as new images from new measurements)
05 may 2021 :
- there were many problems when sending wrong files (ie not conform calibration files, more than one recorded file at same time,…) so I’ve be trying to avoid that workflow gets stuck and no user gets his files !
- some badly formatted calibration files are automatically replaced by flat response in process
25 april 2021 :
- added “noenhanced” mod in gnu octave script to avoid characters enhancements with _ in names
22 april 2021 :
- in case of no mic cal file, the response could have a 10dB shift : corrected
- recording files are now accepted in stereo for .wav, .flac and .aiff
21 april 2021 :
- added pages “Howto” and “Graphs explained”
15 april 2021 :
- slightly changed some parameters in the delay of lin phase correction
- cleaning of parameters of the upload form (recording, microphone cal,..) to get rid of problems that could avoid the process of the uploaded files
10 april 2021 :
- improvements in accepted mic calibration files, ie last line can now be blank
9 april 2021 :
- changed conditions for distance : now accept both “.” and “,” before decimals, max 4 characters instead of 3
- if files are uploaded with a non valid form, blank fields are filled with default values in the calculation software
7 april 2021 :
- correction of graphs S13 and S14 various gatings, that had an error with mic correction
31 march 2021 :
- corrections for SMPTE, AES, B&K have been added for 5.1
30 march 2021 :
- changes in LF target : in Auto Music mode, the real target being L+R, its value is set at +3dB above the choosen LFtarget. Also changed LFtarget values in form.
27 march 2021 :
- modifications of performance rating calculation
23 march 2021 :
- added B&K as target in the Upload Recording form
19 march 2021 :
- bug correction : in some cases, measurements and/or correction files were L/R unbalanced by a few dB
13 march 2021 :
- changed some “correction” graphs (with y axis +-18dB instead of +-9dB) so to better cope for various measurements and also, for clarification, deleted some graphs
08 march 2021 :
- changes in the measurements list, down on page “Measurements” which was resetted to blank when starting new software version !
- improvements in page 1 of graphs so that responses are better centered to 0dB
06 march 2021 :
- changed some LF targets : you need to fill again this field in the form when uploading in same studio/reference
- correction of some bugs
Measurements
The method is very stable. To check it, just do some successive measurements and compare. We encourage to also measure at different levels to check consistency of your setup and your corrections.
In case you see differences in low frequencies, this may come from some conditions that have varied between measurements : are doors and windows allways in same positions, opened or closed ?
Question frequently arises : how large should you scan around listener head position ? Move in all directions, even height, but avoid to be too near of a reflecting surface, ie stay a bit higher than the back of the chair.
I would scan within about +-15° off axis, that is nearly 50cm in all directions for a loudspeaker at 2m and 100cm at 4m.
Remember that for a home audio system, the MMM scan is mainly to smooth out reflections and not to average for more listeners.
Moving your mic too fast may cause noise on the recording. This gives errors seen as a level increase of very low frequencies on the frequency response graphs.
When you adjust the sound level so that the voice is nearly same as a speaking women in your room, the level of sweeps is between 75 to 80dB SPL(C), pink noise on one channel is also about 75 to 80dB(C). After having finalised EQ, you may want to adjust level to a known value : use the pink noise at the end of the wav files, which is in conformity to SMPTE2095 with rms value at -18.5dBFS. Adjust one channel at the target SPL slow with a sonometer in dB(C) and slow reading, and fine tune other channels by ear to same perceived levels. By ear you can adjust at nearly 0.2, while with a sonometer, it is difficult to be better than 0.4dB.
For many people, most curves and graphs are not so easy to understand so some of you have asked about a simple performance rating. We have tested the ratings proposed by Sean Olive in AES papers 6113 and 6190 but for some reasons, it was not totally satisfying. Those ratings are based on anechoic room measurements extended to Predicted In Room results. With our method, we only measure InRoom values and we have to quantify performance based only on those real measurements.
We get the score from three main factors :
- SM_IRR SMoothness of InRoom Response between 125 and 11500Hz : the proposal of Olive is not very intuitive (Pearson coefficient) and this value is not used by us
- NBD Narrow Band Deviation of InRoom Response between 125 and 11500Hz (6.5 octaves) : measured surface difference between 1/20th octave curve and 1/2 octave curve, so it is not related to target and general slope
- WBD Wide Bandwidth Deviation of frequency response from target curve : it is a value based on area difference (so related to variance) between the measured response and the target response between 125 and 11500Hz
- LFD Low Frequencies Deviation is based on area difference between the measured L+R response and the target response between 25 and 125Hz (2 octaves) but calculated on a linear frequency scale. We use a linear scale because we consider that problems at the high part of this frequency range are more audible and problematic than at the vey low frequencies. Note that this low frequencies target is flat under 80Hz (it does not take in account the high pass filter value of the target, so it not not exactly same as the LF target defined in the Upload form and is calculated from the choosen target +6dB to account for the L+R instead of only one channel.
- please notice that the displayed mean value is the lowest of L and R values or L, C and R in case of multichannel
Global performance rating = 0.25*NBD + 0.4*WBD + 0.35*LFD
It is important to understand that the rating is only based on measured amplitude response and is missing other factors that may influence audible quality : max levels, directivity, distortions, phase and time response, etc… So be carefull when you compare ratings of different systems, ie the highest may not be the best ! But comparing results before/after equalisation/correction is certainly valid.
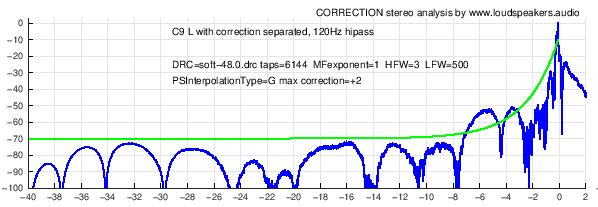
If field “Measure and correct” is validated, subdirectory “Correction” is created to contain.wav files for FIR correction, respectively Left and Right in linear phase and minimal phase : xxx-hyblinL.wav, xxx-hyblinR.wav, xxx-hybminL.wav, xxx-hybminR.wav. Those files can be directly used for corrections.
Pages p7 to p9 are also created.
| p7 Correction |
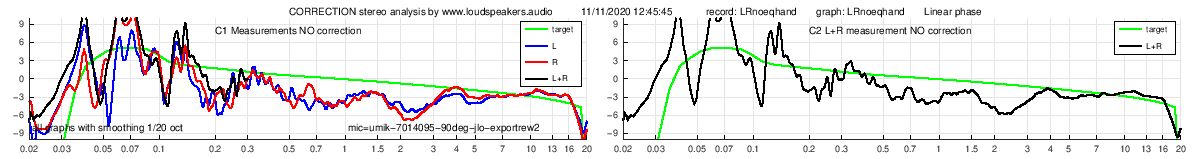 |
| Separated C1 measurements L and R and also L+R (C2 black) |
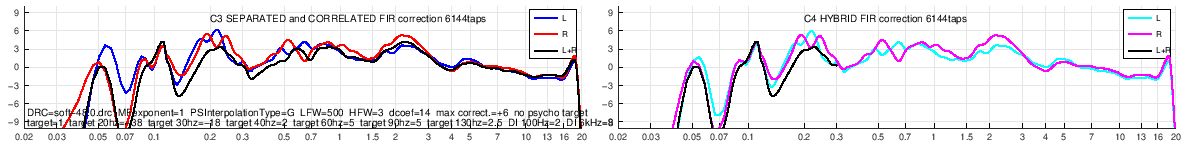 |
| FIR corrections C3 calculated from L, R and L+R and hybrid corrections C4 (same in lower frequencies and separated above) |
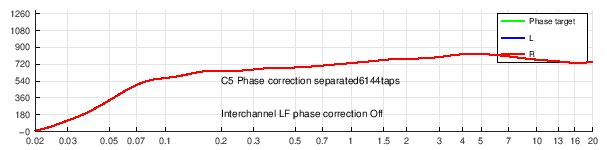 |
| C5 Phase correction |
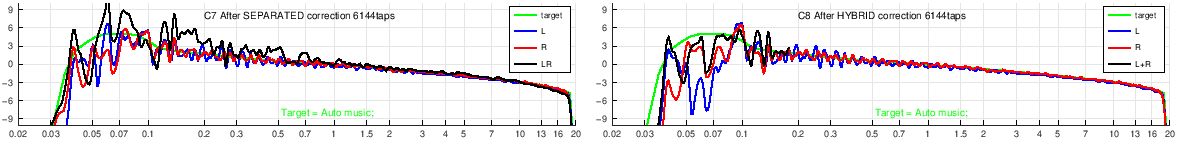 |
| Simulated responses of L, R and L+R after FIR correction : C7 for separated corrections and C8 for hybrid correction |
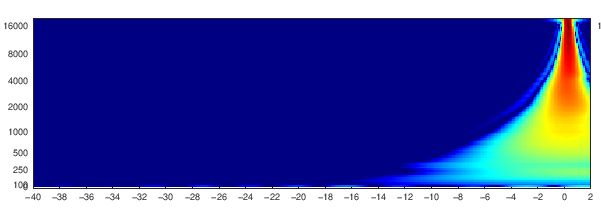
| p8 Simulated ETC energy-time curve after correction for pre-echo visualisation |
 |
| p9 Simulated wavelets for pre-echo visualisation |
 |
Exponential sine sweeps (promoted by A. Farina) is a very nice technique to measure loudspeakers response with a good rejection of noises. But it may have problems when the player or recorder clock are unlocked (ie when you record on a computer that is independant of the player). In this case, the displayed impulse and step responses, spectrograms, wavelets,… may be distorded (don’t worry, the MMM part and so frequency response and correction are not affected). To avoid those problems, we have added in LA2v3 version, another time sync signal at the end of the audio sequence to automatically compensate for clock mismatch. The value of drifted samples is indicated in page p0. If mismatch is less than 2000ppm (CD Redbook specifications is 200ppm), the recording is resampled. This corresponds to about +-15360 samples for the stereo file. If mismatch is higher than 15360ppm, this is not considered as a clock difference but as a recording problem (ie usb dropouts,…) and so the recording is not resampled.
If some folders are empty without any graphs, it may be that the user did not upload any measurement, or deleted the files or uploaded measurements as private.
How to record
Download the sound file in stereo or multichannel, link is on page upload
This file can be written on a CD or DVD or streamed by a computer or added to a DAW session (Protools, Nuendo, Pyramix,…)
Play the file in stereo on your loudspeakers and record simultaneously with your microphone.
- start recording and then playing just after : there is a 5s starting silence so you have time to get to the listening position
- keep the mic fixed at listening position : sync bong is followed by 3s left sweep and right sweep. Sweep signal is a sine signal which frequency is changing from very low to highest frequencies
- voice «move mic to left » : place the mic fixed at about 30cm left to listening position, signal will be a 10s sweep on left followed by a sweep on right and a sweep of both channels together
- «move mic to right » : place the mic fixed at about 30cm right to LP, sweep on left followed by sweep on right and a sweep of both channels together
- «slowly move mic » : slowly move mic in a volume of about 1m3 around listening place : pink noise 20s on left channel, 20s on right channel, 10s of correlated noise on both channels followed by 10s of pink noise with phase between channels. In larger rooms, you can move mic in a larger volume : 1/5th of each dimension is a guideline.
- do not stop while playing or recording : the file has to be played and recorded in one pass
The easiest way is to use the record function available directly on the page Upload recording but it is an experimental function : depending on browser and operating system, you may have some clics or have level compression. So better record with another method for the moment.
You may record directly to your computer combined to a measurement mic, using the record function on page “Upload my record”.
On a computer, there are some free softwares to play and record simultaneously : ie Audacity has an overdub function (in preferences) : https://audacity.fr/
You can also use a portable recorder (Zoom or others) or your mobile phone with a usb mic : ie Iphone and Umik connected with a lightning-usb adapter.
Using a mobile phone, it is recommended to compare to measurements done another way to be sure than the recording feature of your phone does’nt reduce frequency response.
Record in uncompressed format .wav mono, 16bits or 24 bits, 44.1 or 48kHz (aiff or flac will be accepted later).
In all case be sure to avoid any process on the played sound file and on the recording : no EQ, compressor, limiter, filter,…
Record in uncompressed format .wav, .flac or .aiff mono, 16bits or 24 bits, 44.1, 48, 88.2 or 96kHz. Stereo files are also accepted but only left channel will be used : better record in mono, the upload is quicker ! Lossless compressed files in flac are also accepted and will speed the upload. The recording must start 15sec or less before the voice announcing “start to record now”. After the end of the sounds sequence, do not leave more than 30 seconds recording.
- sound level must be high enough, ie the voice level should be comparable to someone speaking in the room, also avoid any clipping on the recording
- notice that we have no responsibility due to too high levels : start with low levels
- record without filter, compression or any process or EQ (unless you do a measurement with correction EQ).
- the recommended mic is MiniDSP Umik, at a resonnable price under 100€, connected in usb so you need no preamp. This mic is delivered with an individual calibration file at 0 and 90° : https://www.minidsp.com/products/acoustic-measurement/umik-1 or http://www.audiophonics.fr/fr/micros-de-mesure/minidsp-umik1-micro-mesure-usb-omnidirectionnel-p-8269.html or https://www.amazon.com/miniDSP-UMIK-1-Measurement-Calibrated-Microphone/dp/B00N4Q25R8
- keep the mic vertically , pointing to ceiling, with the hand low on mic. Note that you have to send the corresponding calibration file (ie the one for 90°)
- for left, right, front and rear position, better change slightly mic height
- while sweeps, distance between positions is about 30cm for a studio or listening room and about 1m for a theater or large mixing room
- with pink noise, the volume scanned by the mic is about 1mx1mx0.5m (Lxlxh) for a listening room or a studio up to 3mx3mx1m for a large room (preferably use a mic boom)
- avoid any obstacle between loudspeakers and mic when moving mic
- don’t move mic less than 30cm of obstacles (seat, table, console,…)
- while moving mic, take care to constantly vary distance between mic and your body
- the way to move mic is not very important but allways move slowly to avoid wind noises, ie 30cm/second
- the whole stereo sequence is about 2mn 30 seconds
- synchronisation is automatically done by software : no need to precisely cut the record by keep less than 15sec before voice start and keep the whole record up to the end (sequence can be cut anywhere after end of sounds, but not too long to avoid excessive upload time ).
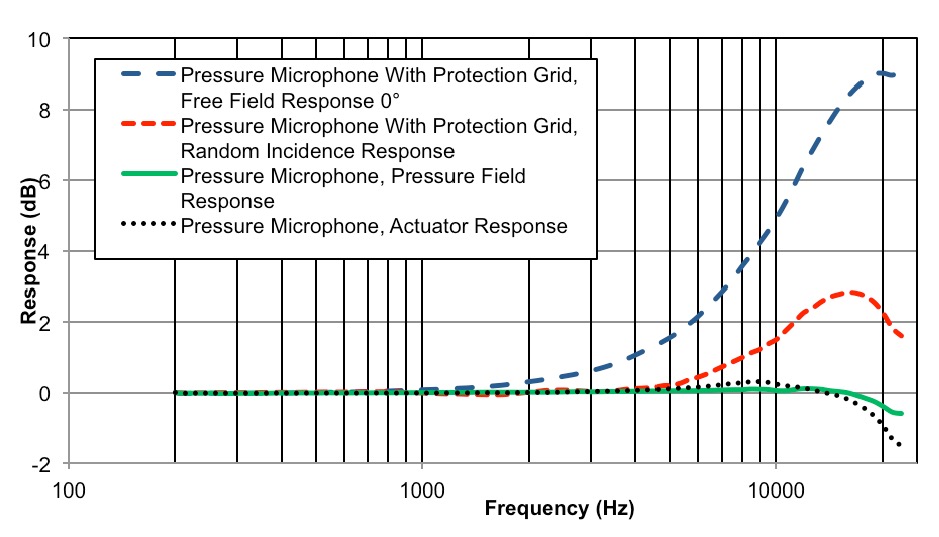
We recommend the MiniDSP Umik 1, which is a usb microphone so no need for a preamplifier. This mic gets two individual calibration files, one at 0° and one at 90°. But other calibrated mic can do the job. Even better if you get a random incidence response for your microphone.
Preferably use the mic vertically and upload the 90° cal file. Ideally the right calibration would be for random incidence but more often you only get 0° and 90° responses. With a Umik the random incidence is nearly 3dB higher at 20kHz than the 90° response. It means that if you use the 90° calibration, you are a bit over-correcting and the real response of your loudspeakers is about 1dB lower at 10kHz and 3dB lower at 20kHz. See hereunder corresponding graph from IEC standards. You can see some examples on measurement mics websites such as GRAS or Bruel&Kjaer.
One type of measurement may be spoiled by cheap microphones : because some microphones have have quite a high intrinsic noise, the distortions figures may be hidden into the mic noise floor. This can be improved if measuring at a higher sound level (but be careful with your ears and louspeakers).
If you have a calibration file, send it together with the recording in the version corresponding to your use (ie version at 90° if mic was used vertically, as recommended). If you have no calibrated mic, choose None/flat. Important : the calibration file is the response of the microphone, not the correction to apply !
For Umik, send the manufacturer cal file. The level reported in the graphs is calculated with the recommended 18dB gain of the Umik together with the sensitivity from calibration file (this is important for multichannel movie setups to be in conformity with SMPTE standards).
For “Other”, send a file named “calibration.txt” with first line at 0Hz and last line at 24000Hz, with a space between frequency and level such as :
0 -20
20 -0.1
1000 0
20000 0.1
24000 -20
Decimal separator should be “.” (dot) and not “,” (comma)
Your calibration files will be processed and saved as “response.mic” in the same folder. If you are sending new recordings the same day for the same studio, you don’t need to send the mic calibration file again.
If your calibration fike is not valid, it will be replaced by a flat mic response, same as without any cal file.
Measurement microphones, electret, electrostatics or MEMS, are generally considered as minimum phase devices in the frequency range we are interested in. So the calibration file does not need to have phase included but those files are valid if phase column is after amplitude column (but we do prefer cal file without phase to avoid mistakes).
If you have no calibration file, upload only the recording and no .txt file. The software will then use a flat calibration curve. Depending on your mic, the results above 5kHz may be wrong.
Start to play our sound file at low volume, adjust so that voice is at a realistic level. Following those advices, there is no risk for your loudspeakers.
For acoustic measurements, you really don’t need high sampling rate files to play or to record. So we choose to produce our sound files at 44.1 or 48kHz. For your recording, you can use any sample rate because the file will be resampled to 48kHz for analysis.
If you use a USB microphone such as the MiniDSP Umik, you may find a problem with your measured impulse response : the impulse itself is not clean and shows many peaks together instead of just one. This may come from USB problems : gliches or short drop-outs while recording gives such problem. The clock drift itself, coming from a mismatch between player clock and recording clock is compensated by resampling the log sine sweeps thanks to dual chirps at start and end of the audio sequence.
Glitches or drop-outs may be avoided by checking and optimising following parameters :
- remember that the max length of a non-damaged cable is about 3m for USB class 1 (so try with another certified cable)
- in windows configuration/system/advanced parameters : adjust for best performances and activate “background services”
- USB sharing : change USB port and try tu use a port not shared by other components,
- in BIOS, try to modify PCI bridge latency timer (PCIe don’t have latency timers)
- in BIOS, disable CPU throttling
- disable unused sound devices
- disabled all energy saving options and set power plan to max efficiency
- set highest priorities to the recording process
- deactivate temporarelly your antivirus
- some usefull links :
Optimise Audacity and computer
Optimising-your-PC-for-Audio-on-Windows-10
PC-Optimization-Guide-for-Windows-8
Troubleshoot-USB-dropouts-audio-glitches-Windows
Troubleshoot-USB-dropouts-audio-glitches-Mac
AES paper 8169 : Impulse response measurements in the presence of clock drift
And for everything related to audio on computers :
Form "Upload recording"
- Fields “Company or title” and “Studio” are used to rank measurements in a structure title/studio/date, date being automaticcaly written. So you can check evolution of performances in time and see any degradation. Important : do not use of company name for which you have no rights, your account may be terminated without notice.
- Field “Reference” : a folder with this field will be created. For home users with just one audio system, you may leave this field empty or fill with “home” or “listening room” or “without correction”, “with correction”, aso. For companies with more than one studio, you may enter the Studio name. If you want to upload more than one measurement, it is better to do it in different folders, this way graphs will be easier to read. You can hide your measurements to other users if you add “PRIVATE” in upper cases into your reference field,
- Accents and special characters are not allowed in most of the fields. Allowed characters are alphabets, numbers, space and underscore (_). No space or _ at start or end and no consecutive spaces or underscore.
- In “Volume” and “Distance”, just put the value ie “2.5” (ie the “m” in 2m is not allowed !)
- When a field is red because it is not correct, do not try to go on upload : correct the field before
- Field to choose Test/Measure/Correction : “Test” allows to verify if the record is valid to give correct measurements, even if you bought no plan.
- “New correction” is possibility to keep all values of the form and just change “Timbre target” and/or “LF target” to reprocess. You may want to change the record name so not to loose old corrections and be able to compare.
- For other fields, have a look at other FAQs.
- It is important to fill the form with no field in red and save it before to upload your recording. Otherwise you won’t get your graphs processed !
- And remember that all your fields values are saved for next time, so less work for you for future measurements !
In page “Upload recording“, you can upload a .wav, .flac or .aiff file for the recording and a .txt file for the mic calibration file. Max file size is 60MB.
In page “My files”, you can upload jpg and png picture files to your folders to show your room or loudspeakers.
Please do not use upload an old record you have done with an old audio file : compatibility is not assured and it’s better to download latest file and do a new recording to benefit from latest improvements
For stereo, the channels order is allways L R. But for multichannel setups, it is important to choose the real channel order so that the graphs show the exact channels : ie for 5.1, you can download L-C-R-LFE-Ls-Rs (movie order which is left, center, right, LFE, left surround, right surround) or L-R-C-LFE-Ls-Rs (SMPTE order). Also check which file you have downloaded : .flac files use SMPTE order (see https://xiph.org/flac/format.html ).
The audio files to download and play are named by convention :
LA2v4 means Loudspeakers.Audio file, for 2 channels (stereo), version 4.
And so on for LA51v4, LA71v4, LA712v4, LA714v4,….
It really depends on your loudspeakers. In some cases, if you want to adjust the slope of the target curve, you could change the directivity at low or high frequencies set in the form.
For reference, here are the values used for calculation :
High frequencies, Omni/Dipole/Standard/Horn = 2/5/8/12
Low frequencies, Omni/Dipole = 2/5
Following fields are needed for the calculation of your optimised target curve :
- Field “Target curve” : “Auto music” is recommended for home HiFi and pro music studios. For calibration of theaters or mixing rooms, SMPTE targets maybe be used with a choice depending on room size. Other possibilities are AES and B&K bin some cases. The new “Dolby Atmos Music” target has been added to comply to Dolby Home Entertainment specifications.
- “Timbre target” (only valid if “Auto music” is choosen) : the standard “Balanced” can be adjusted on user preferences to Bright (sharp, more high frequencies) or Warm (darker, more low frequencies). Difference to “Balanced” is a slope of approximatively +-0.3dB/oct (exact value depends on measurements, distances and directivity) so nearly +2dB at 10kHz for “Sharp” and -2dB at 10kHz for “Warm”. If those standard “bright, balanced, warm” don’t exactly fit your needs, you may ajust by modifying your volume or distance values : increase volume or decrease distance brings you more in direct sound so targets change a bit to more “bright”.
- “LF target” (only valid if “Auto music” or “Auto cinema” is choosen) : low frequency target is defined by cutoff frequency and level under 100Hz ie “409” means a 40Hz cut and +9dB level. Level at cutoff freq and at 130Hz is 0.5*max level. As LF target Auto is optimised for both speakers together (L+R) but relative to L and R separated, so to get a flat response for each separated channels, choose a value ending with 0 (ie 400 or 600), because L+R in low frequencies gives nearly +3 or 4 dB (or +6dB for a common subwoofer) compared to response of L or R separated. With lower taps value (ie 3072 or less), to get expected response (see simulations in p7) better use 100/103/106 values to avoid adding a cutoff to the correction already limited by number of taps. Please note that before 24/08/24, the target was given for L+R, now it is for each channel separated, ie if you choose 603 before, now you would choose 600.
After the target curve is calculated, it is available in ‘My measurements’ as ‘target.drc’ so you may use this target for other purposes or in another correction software.
The whole procedure gives a calculation of the so-called “house curve”. It is based on the recording itself (ie the calculated frequency dependant reverberation time) but also on parameters you entered in the form : room volume, distance, directivities. Note that if you choose SMPTE, AES or B&K curves, those will directly be used as targets and no calculation adapted to your own setup (in this case, LF and timbre target won’t be used)
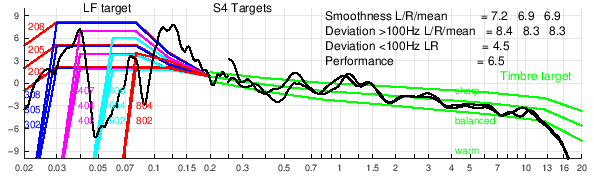
To suit your needs, you can choose “Auto music” and adjust the target with Timbre target and LF target :
- LF target choice between 100 to 806
- Timbre target bright/balanced/warm
Those choices you can set on the Upload recording form. The timbre target slopes are not fixed but depend on your measurement. If you know that your loudspeakers are quite neutral from a high quality manufacturer, and you are quite happy with the overall soud balance, we would suggest to choose the target that is the nearest to your measured curve, ie here the “balanced” one.
At bottom of the form in page “Upload my recording”, depending on your plan, you can choose between some options :
- “Test” gives the possibility to verify if the record is valid and if it will give correct measurements, see here.
- “Measure” starts the analysis of uploaded file to write Measurement graphs.
- “Measure and correct” adds calculation of FIR correction corresponding to your processor.
- “New correction” keeps all values of the form, so you just change “Timbre target” and/or “LF target” to reprocess. You can change the record name and upload again so you will not rewrite on old corrections and keep possibility to compare.
Page TEST p6 shows graphs Rec1 to Rec5
| Real measurement |
Idéal curves (simulated) |
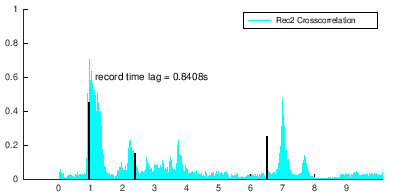 Graph Rec2 shows detail of non synchonised record Graph Rec2 shows detail of non synchonised record |
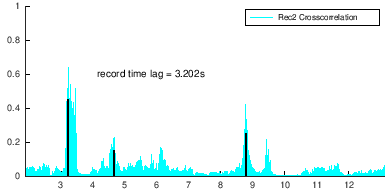 Synchronisation is correct when value “record time lag” corresponds to max and 3 black lines are aligned to peaks. Synchronisation is correct when value “record time lag” corresponds to max and 3 black lines are aligned to peaks. |
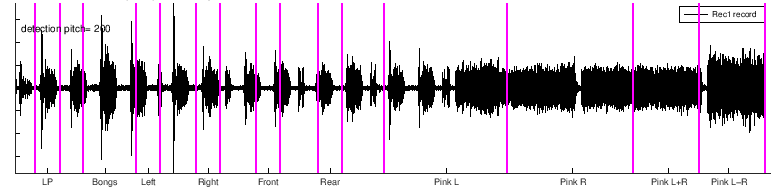 Unvalid Rec1 because lines are not aligned to parts on the graph. Unvalid Rec1 because lines are not aligned to parts on the graph. |
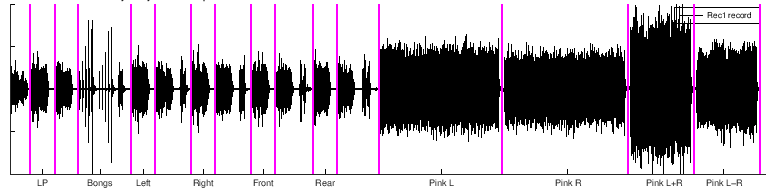 Valid : purple lines should be temporally separating parts. Valid : purple lines should be temporally separating parts. |
Depending on our server workload, it will generally take 5 to 10 minutes to get all your results. Be sure to use the refresh button to see the actual files.
For some reason, you may get not measurement graphs (don’t forget to use refresh button before complaining !).
First check : be sure that you have correctly FILLED all needed fields in the upload form and SAVED the form. Also check that your recorded sound file has a valid format, contains the start of sequence and does not start more than 15 seconds before the first voice.
After having checked, detelete all files in your studio/reference folder (use the menu “My measurements”) and upload your files another time but giving it another name.
Other infos you’ll find in FAQ Problems and Errors.
Please do not uploads many recorded files one after the other : this could bring to problems of mixing wrong form with wrong record due to uploads time.
Do your recording, upload corresponding record, do another recording and upload after.
My measurements
In “All measurements“, you will see pictures of all companies and studios. In “My measurements“, you will only see the files that are in your folders but all type of files, wav, txt, calibrations, images and correction files (.wav). And you have the possibility to upload, delete, move, rename and modify descriptions.
The folder “My measurements” will allways be available to a user even if its plan is over.
Here is the folder structure for your files. Folder in red are private and only seen in “My measurements” so not seen by other users.
Company or title
Reference, studio
Date
myrec-p0.png page to check recording validity
myrec-p1.png main graphs
myrec-p2.png time and phase graphs
myrec-p3.png various graphs
myrec-p4.png spectrogram and wavelets
myrec-p5.png bongs timing
myrec-p6.png InterChannels Phase Correction
myrec-p7.png amplitude correction
myrec-p8.png time correction
myrec.text your setup infos from web form
myrec.wav your recording
response.mic mic calibration reformatted
mymic.txt your mic calibration
correction48 corrections for a processor that works at 48kHz
target.drc target with 3 columns : frequency, amplitude and phase
bin with corrections for minidsp processors
myrec-lin-L.bin
myrec-lin-R.bin
myrec-min-L.bin
myrec-min-R.bin
json with corrections for QSys and Xilica processors
myrec-lin-L.json
myrec-lin-R.json
myrec-min-L.json
myrec-min-R.json
REW for analysis in REW
myrec-comlin-LR.wav common correction for all channels
myrec-commin-LR.wav
myrec-hyblin-L.wav hybrid corrections
myrec-hyblin-R.wav
myrec-hybmin-L.wav
myrec-hybmin-R.wav
myrec-MMM-Lrew.wav MMM record
myrec-MMM-LRrew.wav
myrec-MMM-Rrew.wav
myrec-seplin-L.wav separated corrections for each channel
myrec-seplin-R.wav
myrec-sepmin-L.wav
myrec-sepmin-R.wav
wav
myrec-lin-L.wav corrections in wav format
myrec-lin-R.wav
myrec-min-L.wav
myrec-min-R.wav
wav-stereo
myrec-lin-LR.wav correction linphase into stereo file
myrec-min-LR.wav correction minphase into stereo file
– folders correction44 and correction88 with wav and wav-stereo folders
– folder correction96 with bin, wav and wav-stereo folders
At the moment, correction files are only calculated for following FIR processors and softwares in both linear and minimal phases versions :
- generic 1024, 2048, 4096, 6144, 8192 and 16384 taps : mono 24bits 48kHz .wav files
- MiniDSP 2x4HD 2048 taps : mono pcm 32bits float 48kHz .bin files
- MiniDSP OpenDRC 6144 taps : mono pcm 32bits float 48kHz .bin files
- QSC Qsys 8192taps : mono 24bits 48kHz .json files
- Xilica Solaro QR1 or FR1 4096 taps : mono 24bits 48kHz, .json or .txt files (ie with Rephase, just export as float 32/64 bits text file)
For FIR corrections, the number of taps is the number of audio samples of the correction impulse, ie for 2048 taps, the length of the IR is 2048 samples (for any format, wav, pcm, bin, json,…).
I don’t think that I will also calculate IIR (parametric) corrections : it is very depending on the actual processor (number of parametrics, Q type,…) and FIR processors are becoming cheaper and more common (ie MiniDSP, Xilica,…). Maybe for parametrics, I’ll just export a measurement file that could be used directly into REW so to calculate IIR correction.
If you bought a plan with correction included, the correction files are found in My measurements page in the correction folder with following names and in both formats .wav (48kHz 24bits) and .bin (pcm 48kHz 32bits float, big endian):
- …-hyblin-L : linear phase hybrid correction for left channel
- …-hyblin-R : linear phase hybrid correction for right channel
- …-hybmin-L : minimal phase hybrid correction for left channel
- …-hybmin-R : minimal phase hybrid correction for right channel
For QSys and Xilica Solaro, the .json files are also available in the “correction” folder.
It is important to use filters at the same sample rate as the processor or software, otherwise you may get distorted sound, noises, artefacts,…
Loudspeakers.audio does all calculation and outputs convolution filters at 24bits and 44.1, 48, 88.2 and 96kHz. So if you need other formats (ie resolution or sampling rate), you can use an online audio converter such as https://audio.online-convert.com/convert-to-wav or other external tool (available in any DAW or free tools such as sox).
Because correction can be positive in amplitude at certain frequencies, it is important to check the global level of the correction to avoid any overload. This won’t generally be a problem inside the processor itself but you need to check at the processor output, before D/A conversion : because many music tracks are mastered at a very high level near digital fullscale, you need to check that level of music with correction never exceeds fullscale. It is wise to reduce digital level so that the max level of correction is under 0dB, ie -1dB is fine. If you really want to avoid any intersample peak, you can even set max at -4dB.
Also when comparing before/after correction, you have to adjust level to match : with typical setup, you will generally need to reduce uncorrected level by some dB for a valid comparison.
The correction process tries to remove any level difference between channels but for QSys and Xilica Solaro, the level correction may be a bit wrong due to a conversion step from audio (the convolution wav file) to a json or text data file which may modify those level. It is necessary to redo a measurement with correction to really check channel levels.
Especially if your processor has a limited amount of taps, ie 2048 or less, it is wise to start with parametric EQ in the lowest frequencies, under 100Hz with manual EQ, and then measure again and automatically calculate the FIR correction. To ease this procedure, you can use REW sofware, import into REW the files named xyz-MMM-(LR)rew.wav in DRC folder as audio data, apply a 1/48 octave smoothing, and use the REW EQ function to find the best low frequencies EQ.
Even for higher taps value, this strategy can be a good one : first do manual EQ in bass before to calculate FIR.
In your measurements, you’ll get an L+R curve which corresponds to a mono signal send to both L and R loudspeakers. This L+R black curve is important because most recordings are mono in lower frequencies and it better represents low frequencies perception.
In some cases, the black curve is lower than each blue L and red R responses. This means that L and R signals are for some frequencies out of phase and instead of adding power, those signal destructing each other ! This has to be avoided and generally you will need to find better positions for your loudspeakers. With one subwoofer this cannot happen because summation is done electronically without any phase opposition. The hybrid correction computed by loudspeakers.audio tries to optimise L+R but sometimes it cannot completely solve this important problem.
The easiest way is to go to “My measurements” and for each folder, you see “Add files” with + button to upload your pictures.
You can also use the “select” button at bottom of “upload recording” form and choose a picture to upload.
If you want a thumbnail for your “Company or title”, keep the field “Reference, studio” blank. And if you want a thumbnail for a certain “Reference, studio”, just fill this field, save and upload the picture. Only .png and .jpg pictures are accepted.
After applying correction EQ, you can enjoy listening but it is very recommended to also re-measure after EQ to check validity of the applied correction. You may also check at different sound levels.
If you change your loudspeakers positions, you should redo measurements and calculate another EQ. Most changes will affect frequencies under 300Hz.
If you do important changes to your room, you should redo measurements and calculate another EQ.
If you cannot get your measurements, there are many possible reasons :
- if your folders names (company or title, studio,…) contains accents or special characters, graphs may not be calculated
- the audio file may be missing the sync signal at start or may be too short at the end. There should be one second or more after the sync signal at the end.
- microphone calibration file may not be conform : ie take the umik file from scratch, do not add any line even blank !
- calibration file must also be in right order : frequencies must be increasing in all lines, with lower frequencies first
- too long a path may be a problem because we use ftp copy for some files : so name of your company + name of studio or ref + name of your measurement file (or mic file if it is longer) must be less than about 180 characters
- please avoid accents and special characters in folders or measurement names
- no dots (.) in file names : another dot than the one before the extension will prevent uploading. This is to avoid security problems with double extensions.
- another problem seen quite often : right level is measured much lower than left level ! This may come from your computer or software. When the level is quite high, a level compression is automatically set and the recorded level of right channel (and also center channel) is lower because the compressor has been activated by the left channel signal !
- for USB glitches, read FAQ about USB problems
- If uploads don’t work, try another web browser (ie sometimes Chrome works better than Firefox)
- do not send multiple recordings one after the other, preferably wait for complete graphs before sending a new one
- if you don’t get graphs for a measurement, uploaded it another time but give it another name because successive uploads with same name are not processed
- if problems when viewing in french, change language to english : seems that with some browsers, it may help
For any problem, please get in touch with support(at)loudspeakers.audio
I did a comparison between the report you get here and the GRADE report you get with Genelec speakers (those equipped with SAM) :
This website allows to share loudspeakers measurements in rooms and may help other users to check/compare results. But if for any reason, you prefer to keep your own results hidden, please donate.
After donation, you may just add “PRIVATE” or “private” or “Private” in the “Reference, Studio” name in the Upload recording form. So those folders/files will still appear in “My measurements” but will not be shown to other users in “All measurements”.
You can later delete “PRIVATE” from the name if you change your mind.
Acoustics and EQ
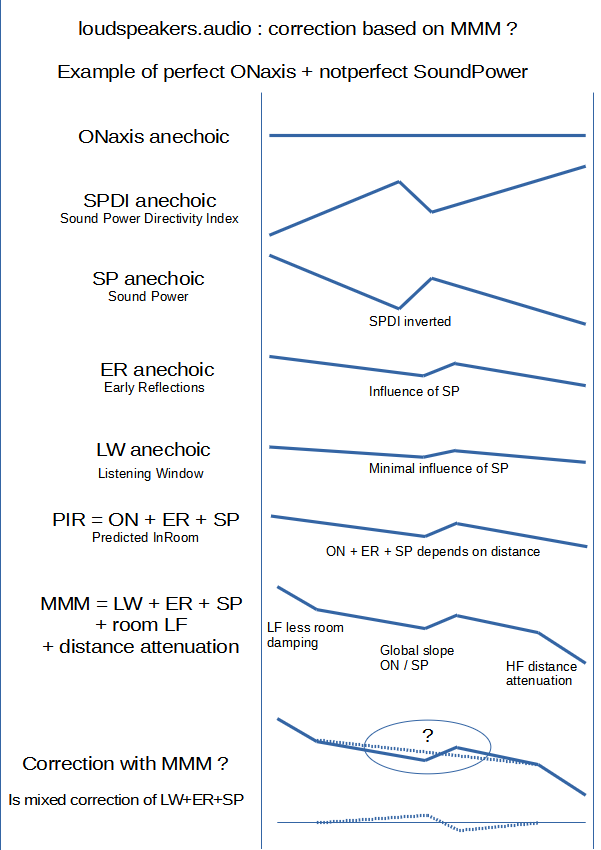
With MMM, you get a measured frequency response between LW Listening Window and ER Early Reflections as per Harman’s terminology. The more the acoustics is damped, the more the measurement is near LW. So the correction that is calculated online on this website is a mixed correction of direct sound field (ONaxis or LW frequency response), ER and Sound Power (the frequency response at all angles). Here is an explanation :
This question often comes when discussing electronic correction.
Let’s separate things :
– under 200 to 300Hz, room modes are allways present in any room (of normal size) and you generally have to smooth peaks, and avoid filling dips (don’t add energy : energy is there but it just cancels at some places)
– from 200 to 500-800hz, the position of the loudspeaker in relation to walls gives peaks and dips, but those acoustic problems can be improved with electronic EQ (above those frequencies, influence of reflections on walls are very dependent on exact listening position and fortunately, the auditory process has a frequency smoothing effect).
– above 600-700Hz, you may need to correct the loudspeaker if its response is not perfect !
So you need a method that shows only (and all) the defects that must be corrected (that’s why I think that MMM is a cool method).
It is important to note that a bad correction may be worse than no correction at all : so it is very important to be able to listen and compare with/without EQ (with levels exactly adjusted).
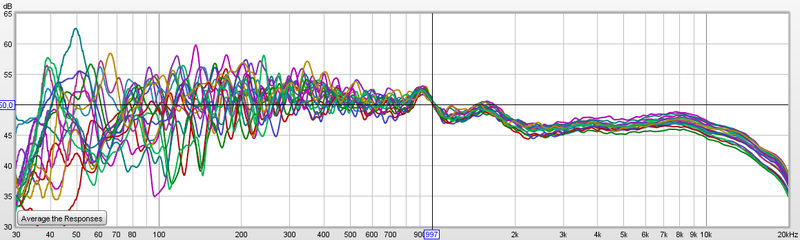
Hereunder is a comparison of 9 MMM measurements of the same loudspeaker in 9 different rooms (10 to 30 m2 surfaces) at distances between 2 and 3m. It clearly shows that :
– under 300Hz, the room is the key
– between 300 and 800Hz, the room and the loudspeaker are both important
– above 800Hz, the loudspeaker is the main factor. The response is the same but the slope depends of the distance and the room absorption (refer to Harman’s PIR Predicted In-Room)
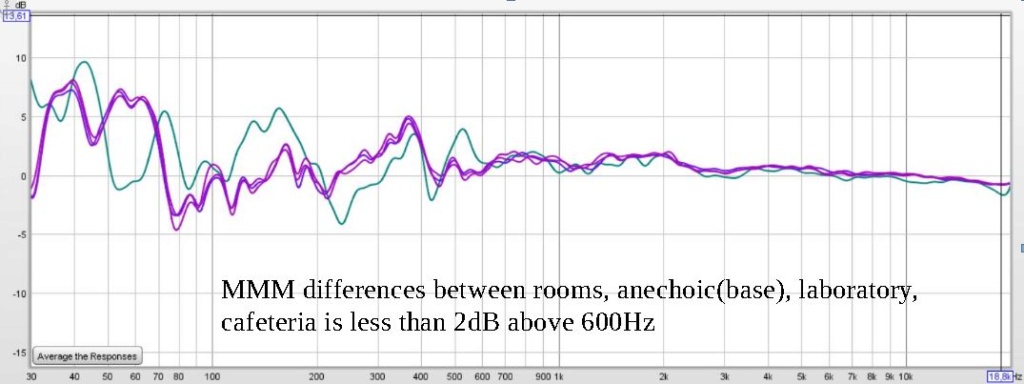
Another comparison : same loudspeaker in anechoic room, and two other rooms (one room was measured 3 times) all measured MMM without any special acoustic correction. Here only the differences between measurements are shown with the base at 0dB being anechoic. You can clearly see that above 600Hz, delta is less than 2dB : MMM is measuring mainly the sound of the loudspeaker itself, not the room.
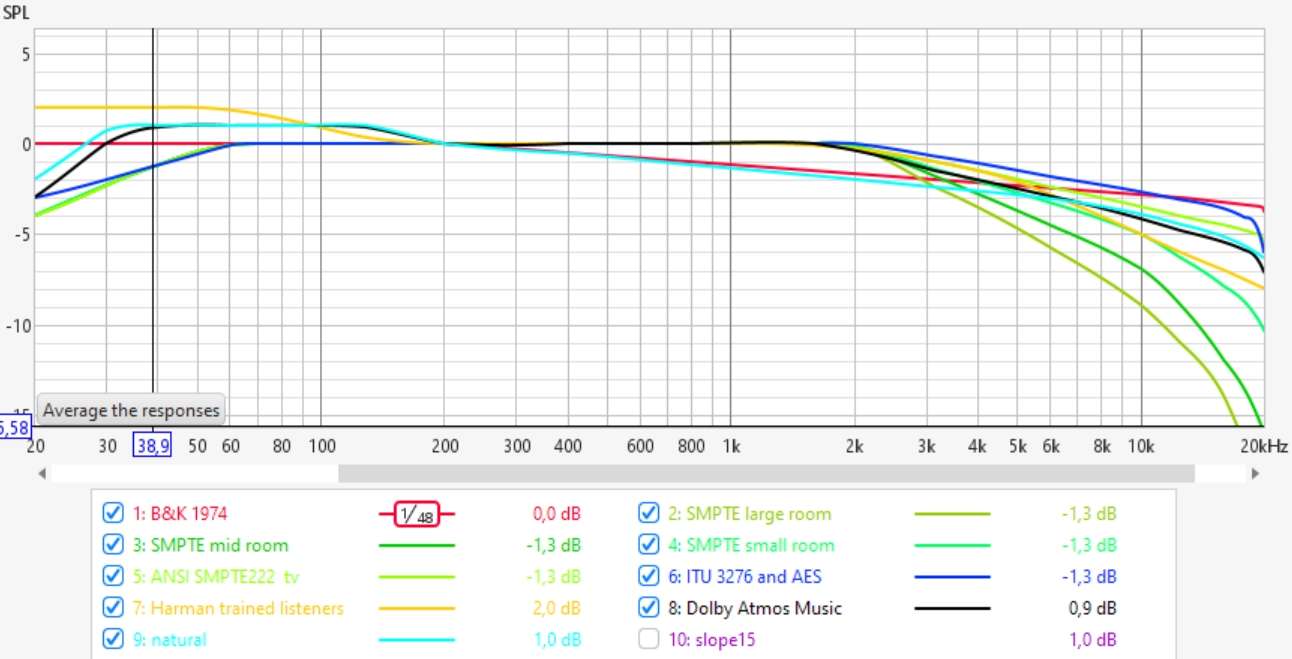
Information about the target slopes :
- -1.05dB/octfor this site’s bright timbre target with standard loudspeakers (dome in high frequency and closed or bass-reflex box in lows) and in a mid size room, at a distance of about 3m
- -1.4dB/oct for this site’s balanced target and standard room/distance
- -1.75dB/oct for this site’s warm target and standard room/distance
- -1.75dB/oct with a prefered LF target similar to LFtarget = 205 (AES convention paper 8994) for the Harman slope (see Olive in AES papers)
- -0.8dB/oct above 200Hz for B&K recommendation dated 1974
- -1.5dB/oct above 1.6kHz with LF target = 304 for the Dolby Atmos Music target from 2021
- -1.2dB/octave for best corrections found in Sean Olive’s tests in EVALUATION OF ROOM CORRECTION PRODUCTS (see elsewhere in this FAQ)
- in studios, with more acoustic treatment and nearer listening position, the slope is generally less, ie between 0.8 and 1dB/oct
Another way to estimate optimal target slope is to use target curve calculator.
Hereunder is a graph comparing most target curves :
All EQ calculated on this website are meant for speakers at ear height. Due to HRTF (Head Related Transfer Function), sound coming from another height is perceived differenly : place one speaker at ear level and another under or above and alternatively play pink noise on each and listen for differences.
If the center loudspeaker is not at same height as L and R, then should it be equalised with a different target ? Question is open.
In a recording studio where I had to calibrate a main monitoring system with Genelec 1234 and a nearfield pair of PSI A17M, I had this problem. The Genelec were placed quite high, more than 15° above the PSI that were at ear level. For a similar sound balance, I had to ajust the EQ of the Genelec.
An important point : before doing any correction, try to find best place for your loudspeakers, try different presets if you have and optimize as far as possible. Correction works best if you have less problems to solve.
Some steps are recommended before using any electronic correction :
- if possible, do some acoustics treatments, ie absolutely avoid flutter echos at listening place : this is due to reflecting parallel walls, ie a window at your right and a bare wall at your left. Clap your hand and listen for a kind of zziiiing sound.
- listen and do some measurements
- look at low frequencies : especially avoid dips, those cannot really be corrected by EQ. If cancellation occurs, correction of +10dB on the signal also gives +10dB on the reflected signals, so cancellation won’t change !
- maybe use a subwoofer to setup a 2.1 system : a subwoofer may be easier to place it at an acoustically good position, when main speakers do not have many possibilities with position
- A tip about subwoofer place : acoustics is symetrical between source and listener, so you can swap both and have same response. Sometimes, it is easier to place subwoofer on a chair at listening place and listen at different positions in the room where the response is correct and so find best positions for the subwoofer.
- If a bad dip is seen at listening position, try to know what is the room dimensins causing it and use well placed acoustic treatments but it is not so easy : at low frequencies, ie 80Hz, you need a minimum of 0.5m of absorbant thickness to be efficient. A membrane resonator may be less deep but you need measurements before tuning it to the good frequency. Another solution is PSI AVAA : those active bass-traps need no adjusment, can be very efficient but are quite costly (about 3500€)
- If you have active filters, low and high frequencies adjustments, all kind of settings : first do measurements and try to come closer to recommended target response before correction with parametric or FIR filters.
- Before using FIR correction, and especially when FIR is limited to 2048 taps or less, you can manually setup parametric filters in lowest frequencies (if your processor has both parametrics and FIR), ie under 100Hz. This could ease FIR correction. To set those parametric filters, you will find a folder REW in the 48kHz folder with wav files (L, R and LR). Import those files into REW (import audio datas), apply some smoothing and use the EQ automatically or manually. Use the correct equaliser : not allways easy if your own processor is not listed.
In the whole list of graphs, some are more usefull to check acoustic conditions :
Graph S5 in ESSENTIALS page shows RT60 reverberation time in the room which is high if the room is missing absorption. Another common problem is when the RT is really increasing in low frequencies, it means that absoprtion is too low in those frequencies, a problem that is sometimes not so easy to solve.
Graph S6 in ESSENTIALS page gives ETC Energy Time Curve, where you can see if some reflections within the first 20ms are happening. Remember that spund travels 34cm in 1ms, so you can figure where the annoying reflections come from.
Graphs S19 to S23 in ENERGY page, all show dissipation of energy with time but in different manners : spectrogram, waterfall and wavelets, which have various resolutions depending on frequency.
With those measurements, you have enough results to think about acoustic treatments, positions and balance of absorption/diffusion.
There are some sofwares to simulate room modes for simple room geometries (ie parallelepides) and infinitely rigid walls. But this is not real life. Real modes won’t exactly correspond to those calculations because acoustic dimensions are not exactly same as physical dimensions. You can expect an error of 5% or more on frequencies. That means that equalisation based on simulation won’t do a good correction job. It is much better to rely on real measurements.
EQ correction may change your experience and in some cases, you may need some time to become accustomed. But after some time, I’m quite sure that you wouldn’t want to go back without EQ.
Trinnov published an interesting paper about correction.
Which processors to use ?
I would recommend a FIR processor or software because it is easier and more precise for correction EQ (and it can also correct phase). You can either use a hardware FIR processor or process with software.
Here are some hardware possiblities I have worked with (prices are approximate and indicated without VAT) :
- QSC QSYS, max 16384 taps per channel (with max total about 4×8192 for model Core110F), completely configurable, multichannel ie 8in/16out , very very complete features but a bit costly (about 4000€ for the smaller Core110F)
- Trinnov, max (about) 4096 taps per channel (with total depending on stereo or multichannel model), high end product but you can only use Trinnov’s own software to mesure and EQ, not cheap (starts at 4000€ for stereo models). The new Nova line is cheaper but I did not have time to test it yet.
- MiniDSP OpenDRC, max 6144 taps per channel (with total of 2×6144), cheap and stable, only available with digital I/O, less than 300€
- MiniDSP 2x4HD or Flex, max 2042 taps and min 6 taps per channel (the total of 4096 for all channels gives 2042+2042+6+6). Both are cheap. Because those processor work at 96kHz, the FIR correction file of 2042 taps at 96kHz is equivalent to 1021 taps at 48kHz.
- Xilica Solaro QR1 or FR1, max 4096 taps per channel (with max total of 6×4096 but FIR cannot be loaded into presets so cannot be changed on the fly, contrary to QSys), completely configurable (not far from QSYS) with choice of different I/O boards and nice possibilities to remote with Ipad or Android tablets, (increased !) prices start at about 2000€ for QR1 (8 slots for I/O boards) and 3000€ for FR1 (16 slots) without I/O boards (analog boards are reasonably priced, strange that AES is highly priced). Note that those processor can ran at 96kHz but the FIR length is still 4096 taps so less efficient in the lows…
- t.racks FIR DSP408 : max 2048 taps per channel limited to a total of 4096 taps for all channels together but quite cheap, under 600€
- Eversolo DMP-A8 is a streamer that also provides FIR filtering with 2048 taps per channel for about 2000€
- You also may have a look here at another list of FIR processors.
On the sofware side, you may use a convolution engine such as Brutefir, intregrated into a player or a streamer. Equaliser APO or Camila DSP are also nice solutions. Software are very cheap or even free, they need a computer (small ones such as a Raspberry Pi are ok) but need more configuration, not so easy for everyone.
Because hardware processors may be limited on processing power (FIR taps), they also have IIR parametric filters so you can adjust the LF EQ if you have not enough taps for a precise correction in very low frequencies. In France, QSYS, Xilica and Trinnov can be bought at Company 44.1 (with optional configuration and on-site setup)
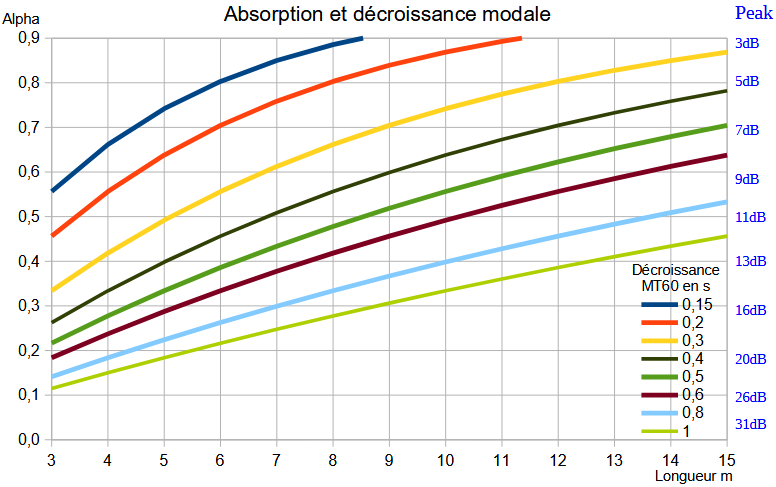
Because acoustics and EQ are complementary, you first need to improve your room acoustics. Measurements can help to understand your actual situation. Considering the maximal measured peak, following graph gives estimation of the equivalent absorption of your walls.
Parametric EQ are also called IIR filters. If you have a standard equaliser with parametric filters, you just do a normal measurement without EQ.
When you get your results and if you choose “measure and correct”, the directory named “correction” contains xyLrew.wav, xyRrew.wav, aso…, files.
If you have REW installed, import those xyZrew.wav with file/import/import audio data.
Depending on your brand/model of equaliser, use the function EQ of REW to ajust your corrections.
For the EQ target in REW, try to copy the target calculated by loudspeakers.audio
When you calculate corrections, you will get both types so you can decide for yourself. Linear filters are named ie xxx-hyblin-L.wav and minimal filters are named xxx-hybmin-L.wav. To be exact, what is called linear phase here is in fact a mixed phase correction, because due to the length of correction (taps number), the phase is not completely corrected down to lowest frequencies.
Pre-echo artefacts cannot appear with minimal phase filters but the linear phase calculated here should avoid any risk of audible pre-echo. Generally, it is better to start with minimal phase correction and compare afterwards with linear phase.
If you have 2048 taps or less for your FIR processor, it is more efficient to use minimal phase correction instead of linear phase.
The audibility of phase is often discussed : large phase distortions are easily heard but common ones such as phase distortions of crossovers or group-delay of bass-reflex or other kind of boxes are not so easy to perceive. But David Griesinger has an interesting theory about phase distortions, so rightclick to following link to download his powerpoint.
With more taps, you get a better precision for lowest frequencies correction. But a too precise correction may be spoiled by varying parameters : temperature or humidity, opened/closed doors or windows, moved furniture, aso… So practically, at 44.1 or 48kHz and for a full range loudspeakers, 2048 taps is a minimum but I don’t think that more than 16384 taps would really be usefull or even recommended. If you only use FIR eq, with no IIR parametrics, I would generally recommend between 4096 and 8192 taps. And if you only have 2048 taps or less available, it is much better to use a minimum phase correction.
And with most FIR processors, start with some parametric EQ to ajust the lowest frequencies and remeasure to calculate the FIR correction.
Remember that for higher sample rates, you have need proportionally more taps : 8192 at 48kHz has same resolution as 16384 taps at 96kHz.
FIR filters can add delay to the signal passing through it. For symetrical FIRs, the delay is half the filter length, ie for a processor working at 48kHz and with 4096 taps, the delay is 2048/48000 second, near 43ms. This is unimportant when listening to music but can be a problem if you need video synchronisation (lipsync) and is a major problem if you work for dubbing or re-recording with musicians,… In those cases, better use the minimal phase correction FIR.
Our hybrid technologie allows a non symetrical Impulse Response, with a delay that is one third of the delay of the FIR length, ie 1365 samples (so 28ms at 48kHz) for a 4096 taps.
Take care if your system has main front loudspeakers with FIR EQ (so are delayed) and a subwoofer with just parametric EQ (so without any delay), you certainly will have to add some delay to the subwoofer…You can check this with the graph p5 that shows a comparison of timings at different frequencies.
Python Open Room Correction is a method wrote by Mason Green and based on the works of Balazs Bank. His publications are available on the AES website. It is a parallel filters correction at fixed frequencies converted to a FIR process. More about Mason Green scripts can be found here : https://github.com/greenm01/porc
The corresponding corrections are named with suffix “porc”.
The main problem before or after measurements and correction is the listening session. How can you avoid to be influenced by graphs, by forums, by friends ?
I can only give a few tips in the way of neutral sound:
- listen preferably in mono with only one loudspeaker, timbral defaults are better heard in mono
- maybe also try with one ear blocked (maybe strange but binaural listening has a kind of decoloration mechanism)
- choose mostly audio tracks that can show defaults
- remember that with some tracks, it is not the most enjoyable loudspeaker or correction that is the most neutral one
A few recommendations (I will add more soon) :
- Suzan Vega, Tom’s diner : this should be very dry with less room and minimal reverberation
- Tracy Chapman, Fast car : this song has a really wide and balanced frequency spread from 40 to 15000Hz so you can appreciate spectral balance (another song could be Jennifer Warnes, Bird on a wire)
- Ricky Lee Jones, Ghetto of my mind : a very dynamic song where the drums are recorded with no (or minimal ?) compression. It has constantly more than 30dB between peaks and RMS mean value
Even if dips are less corrected than peaks, correction of dips add some gain. To avoid any risk of overload or fullscale clipping, the correction file automatically lowers the level. For a fair comparison, you need to compensate for this level difference and rise the level (volume) of the corrected setup by about 4 to 8dB.
loudspeakers.audio is the unique online solution, but other answers are available for room and loudspeakers correction :
- Trinnov is a complete solution of software and hardware, efficient but not cheap
- Dirac is generally sold with bundled hardware such as MiniDSP
- Audissey MultEQ is available in some hardware
- Acourate is a renowned software solution
- JuiceHifi Audiolense is software only zdroj článku
- DSpeaker Antimode comes with dedicaced hardware
- Genelec GLM is a software to measure and correct (only) Genelec SAM loudspeakers with, in the latest version, a nice and quite complete report called GRADE, read another FAQ here above
- DRC, designed by Denis Sbragion, is a free but very smart software solution to compute FIR filters but needs a certain technical level
- MSO Multiple Subwoofers Optimizer is a very powerfull tool to improve low frequency range for one or more loudspeakers and/or subwoofers
On some forums, you may find listening comparisons between above products and loudspeakers.audio. It is very interesting to compare measurements before/after EQ but few products give this possibility. If you try or own above solutions, you can use loudspeakers.audio to measure before/after EQ : it is allways interesting…
In 2009, Sean Olive presented at the AES and published a nice paper called “The Subjective and Objective Evaluation of Room Correction Products” with listening tests comparing 5 products to unequalised response : see here.
It is interesting to see that :
- the best correction was obtained with an average of RTA measurements on a volume of 1 to 2m around listening place (so quite similar to MMM)
- measurement after this best correction shows a continuous slope of about -1.2dB/octave, which is between neutral (-1.4dB/oct) and bright (-1.05dB/oct) targets found on average when you use our automatically calculated target