Page TEST p6 shows graphs Rec1 to Rec5
| Real measurement |
Idéal curves (simulated) |
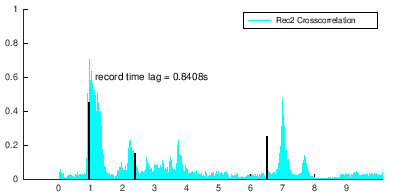 Graph Rec2 shows detail of non synchonised record Graph Rec2 shows detail of non synchonised record |
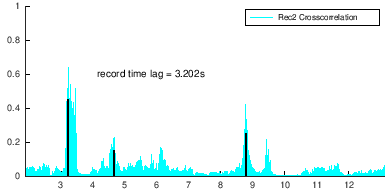 Synchronisation is correct when value “record time lag” corresponds to max and 3 black lines are aligned to peaks. Synchronisation is correct when value “record time lag” corresponds to max and 3 black lines are aligned to peaks. |
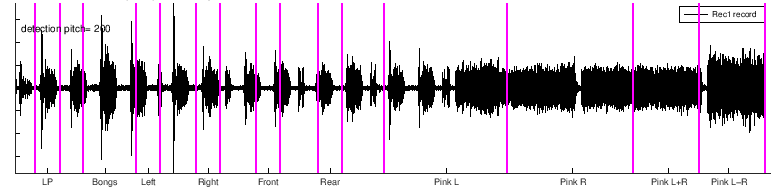 Unvalid Rec1 because lines are not aligned to parts on the graph. Unvalid Rec1 because lines are not aligned to parts on the graph. |
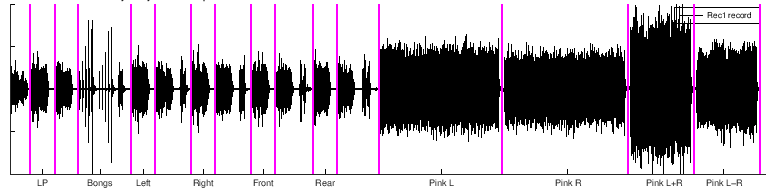 Valid : purple lines should be temporally separating parts. Valid : purple lines should be temporally separating parts. |