If field “Measure and correct” is validated, subdirectory “Correction” is created to contain.wav files for FIR correction, respectively Left and Right in linear phase and minimal phase : xxx-hyblinL.wav, xxx-hyblinR.wav, xxx-hybminL.wav, xxx-hybminR.wav. Those files can be directly used for corrections.
Pages p7 to p9 are also created.
| p7 Correction |
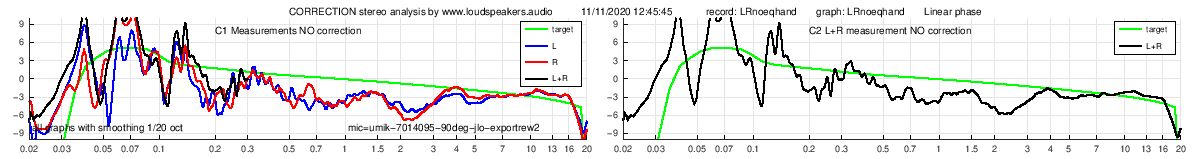 |
| Separated C1 measurements L and R and also L+R (C2 black) |
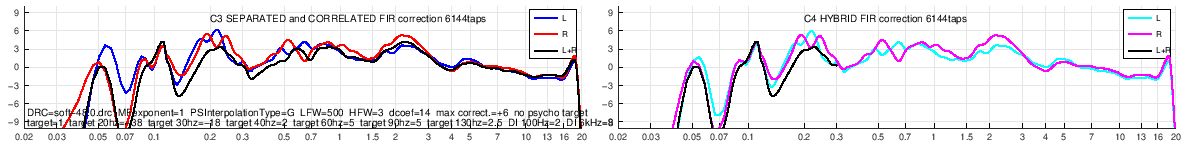 |
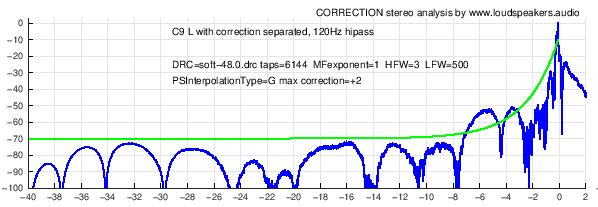
| FIR corrections C3 calculated from L, R and L+R and hybrid corrections C4 (same in lower frequencies and separated above) |
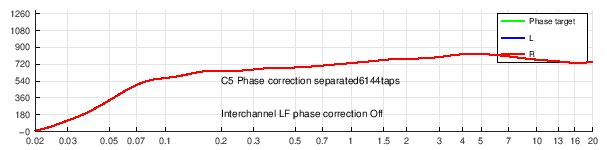 |
| C5 Phase correction |
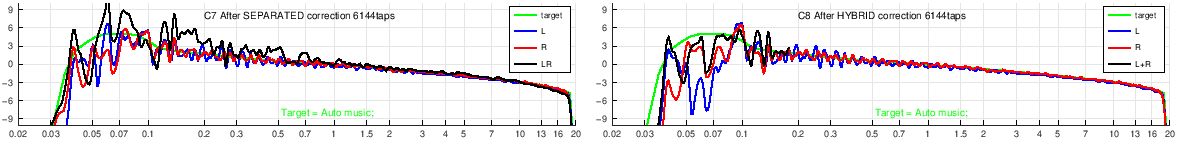 |
| Simulated responses of L, R and L+R after FIR correction : C7 for separated corrections and C8 for hybrid correction |
| p8 Simulated ETC energy-time curve after correction for pre-echo visualisation |
 |
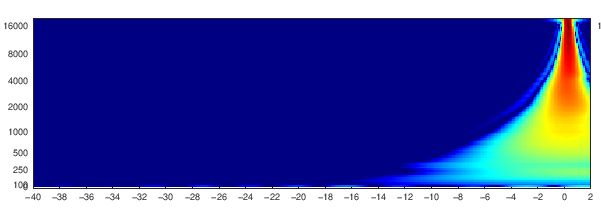
| p9 Simulated wavelets for pre-echo visualisation |
 |